I wasn't sure why there were two different image files provided, so I decided to go with the TIFF since that was easier to work with. I created some blank shapefiles and was about to start editing them, but ArcMap posted up a warning saying that the TIFF and Shapefile projections were different and consequently alignment issues could arise. As a result, I simply recreated the shapefiles and used the "Import" command to define the projections for them.
I printed the TIFF file and went outside to do some surveying. The one annoying thing about the printed image was that due to the angle (and time of day) at which the aerial photo was taken, there were very large and dark shadows in it. The problem was especially bad on the screen, when it came time to actually digitize the data in ArcMap. As a result, it was hard to distinguish certain features and I ended up grouping a number of trees together as one (consequently, I added an additional field to my attribute table to signify the number of "trunks" a given polygon represented). In addition to doing the physical field survey, I also used Google Maps's imagery to help me get a better idea of where certain things were located. However, some elements - such as the foot path boundaries - I simply could not do because they were completely covered with tree crowns (even without any shadows).
I created 4 different shapefiles. Lampposts shows the location of lamp posts with lit lamps in the study area. These can be potentially used to pick the most well-lit route for night-time campus walking. This is a point shapefile. Path boundaries, a line shapefile, shows the edges of foot paths in the study area. These could be used to determine a "legal" walking route between places. There are two polygon shapefiles: buildings and trees. These are self-explanatory, though as mentioned, accurately digitizing the tree shapefile proved to be a challenge.
Once the spatial data was digitized, I went ahead and added some attribute data. During this process I discovered an interesting curiosity - ArcMap does not allow you to add fields to the attribute table when you are in "Edit" mode. Therefore, if while editing, you realize that a certain field is missing (granted, ideally you should determine this information beforehand), you must end your editing session, add the field(s), and then start editing again. This seems odd if for no other reason than the fact that there seems to be no obvious need for such behavior to exist in the first place.
I was ready to finish this lab at home but discovered that this was impossible because the student version of ArcMap does not include the Clean tool in the ArcToolbox. In the process of performing the cleans, ArcMap quietly crashed on me without any notice (Windows didn't even generate an error dump). In addition, it turns out that while a clean is being executed, ArcMap is completely unusable until the clean finishes. One would think that the concept of "multi-tasking" would be fully implemented in an application in the year 2007.
As far as the conversion from shapefile to coverage, there appears to be absolutely no correlation between the shapefiles and the coverages themselves, as far as attribute data is concerned. The FID fields are completely changed to the point where a JOIN would not be possible (for starters, shapefiles start with an FID of 0, while coverages start with 2 for some reason, and there is absolutely no correlation between the two, i.e. not something as simple as FID(shapefile) + 2 = FID(coverage)). The coverage creates fields of AREA and PERIMETER for polygons and LENGTH (as well as FromNODE, ToNODE, and RightPOLY/LeftPOLY fields) for lines. In addition, new polygons were created in the cases where polygons in the shapefile overlapped each other. So two overlapping polygons in the shapefile were turned into three separate polygons in the coverage (assuming they intersected at just two points). For me, this only happened in the conversion of the trees shapefile. The clean would also split arcs in a similar manner, but this did not occur anywhere as far as I can tell.
The clean itself didn't seem to do very much. The polygons
themselves now are arranged in a different order (and thus have
different FIDs) and the last two columns - CVG# and CVG-ID - have
simply changed to reflect the name of the coverage. In addition, the
CVG-ID column now contains zeros for all of the polygons. The
shapes/areas/perimeters of the polygons themselves have not changed.
One change that can be noted is that the path boundaries coverage, when
cleaned, now had a polygon element, which was created from a path that
closed in on itself. In fact, as the default "Feature type" is chosen
as polygon, this was the only content of the new, cleaned coverage
(upon looking in the help files, this makes sense, because Coverages
do not support null geometries. Null geometries will be dropped during
conversion
). This happened in only one location, though at
least two other, similar paths could have been converted in this manner
as well. It is worth noting that while creating a number of path
boundaries, I used the arc tool to create smoother curves (instead of
just defining lines as a collection of single points with the sketch
tool). Consequently, there were a number of discontinuous segments
which were close to each other but not quite joined and the clean tool
could not make polygons out of them. This can probably be fixed by
increasing the "Fuzzy tolerance" parameter in the Clean dialog.
I decided to give it a shot and figure out if there actually
was any correspondence between the shapefile and coverage. One thing I
did notice was that in the uncleaned coverage, the order of the
polygons seemed to be north to south, east to west to east, somewhat
roughly. ArcMap managed to crash on me while doing this. At the end, I
found two methods of accomplishing the result.
One seems hacky and doesn't quite last entirely. If you turn on labels
in the original shapefile and set the label to be something unique,
such as the FID, then the conversion to coverage retains this info in
the attribute table. However, performing a clean on the resultant data
removes all of the attribute info, despite keeping the fields.
I decided not to pursue this further when I realized of another, more
reliable method.
The more reliable method is to use the "Calculate geometry..." tool.
The <COVERAGE>-ID field in the cleaned coverage is a
user-editable field that can be used for custom data. It requires two
important features: that the data used is unique and that the values
are integers. Consequently, the geometric calculation join will not
always work in case of objects being extremely close to each other and
having equal integer coordinates as a result of the currently-used
projection. Basically, to make this work, we do the following.
That will give the desired results. Of course, we must
remember that
overlapping polygons will have "null" data since they do not exist as
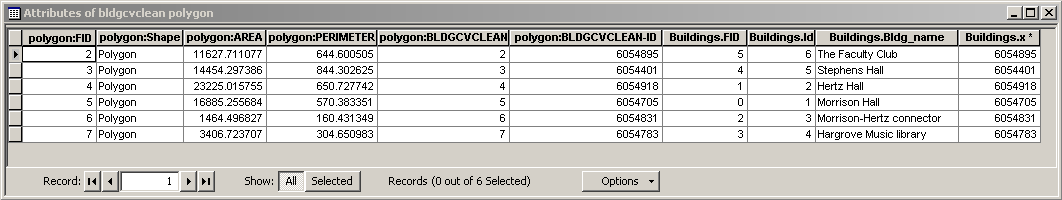
separate polygons in the shapefile. Here's a sample screenshot of
joined buildings data:
