Lab2
Jump to Maps – Components of ArcGIS – Supported data formats
Maps
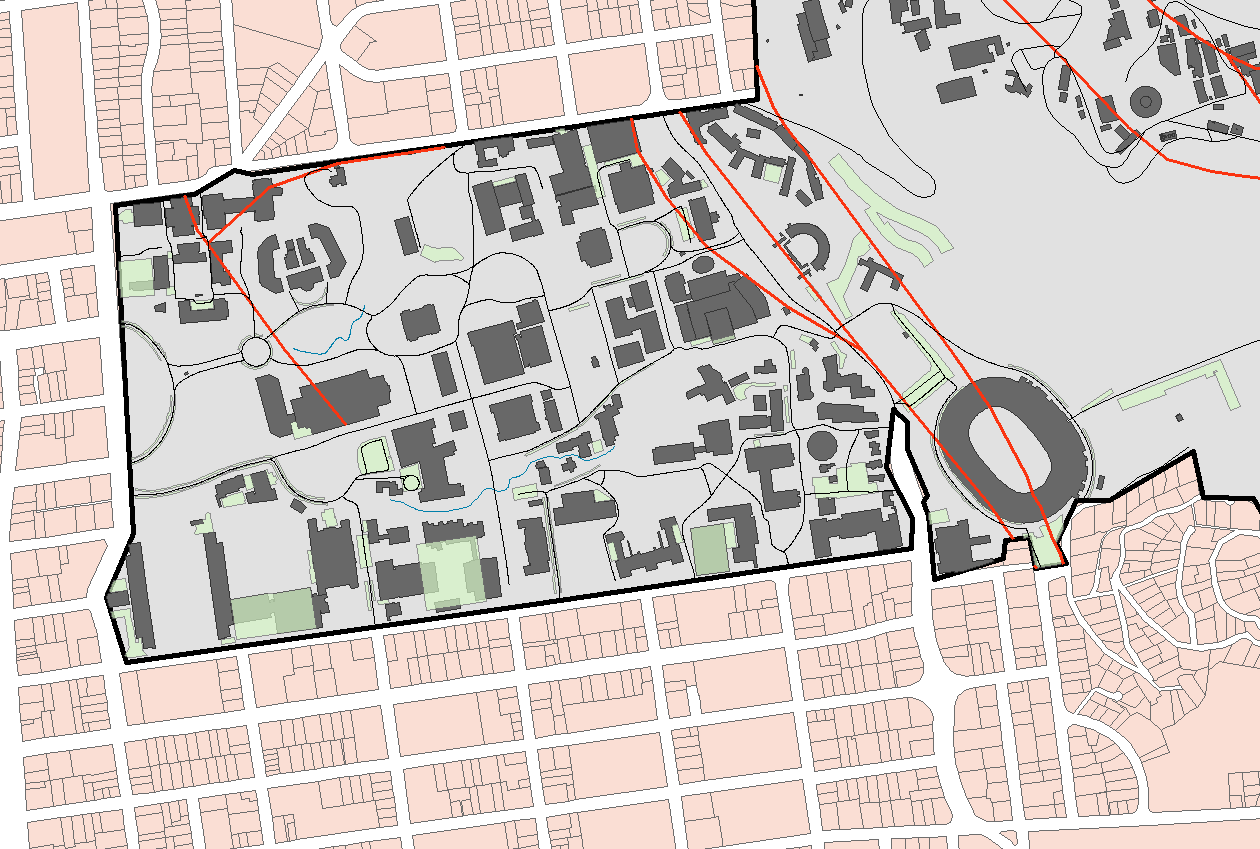
This map shows the roads and parking available on campus along with
campus buildings. Fault lines are also depicted so that drivers know
which areas to avoid in the case of an earthquake. In addition, by
mapping the "parcel_b" layer, we can see (in white) the roads outside
of campus. The parking areas are drawn with a transparency level of
30%, allowing us to see underground lots without covering over the
buildings that they are located under. I'm not sure why but intially I
had a lot of trouble with this. However, once I figured out how to set
the transparency correctly, everything was OK.
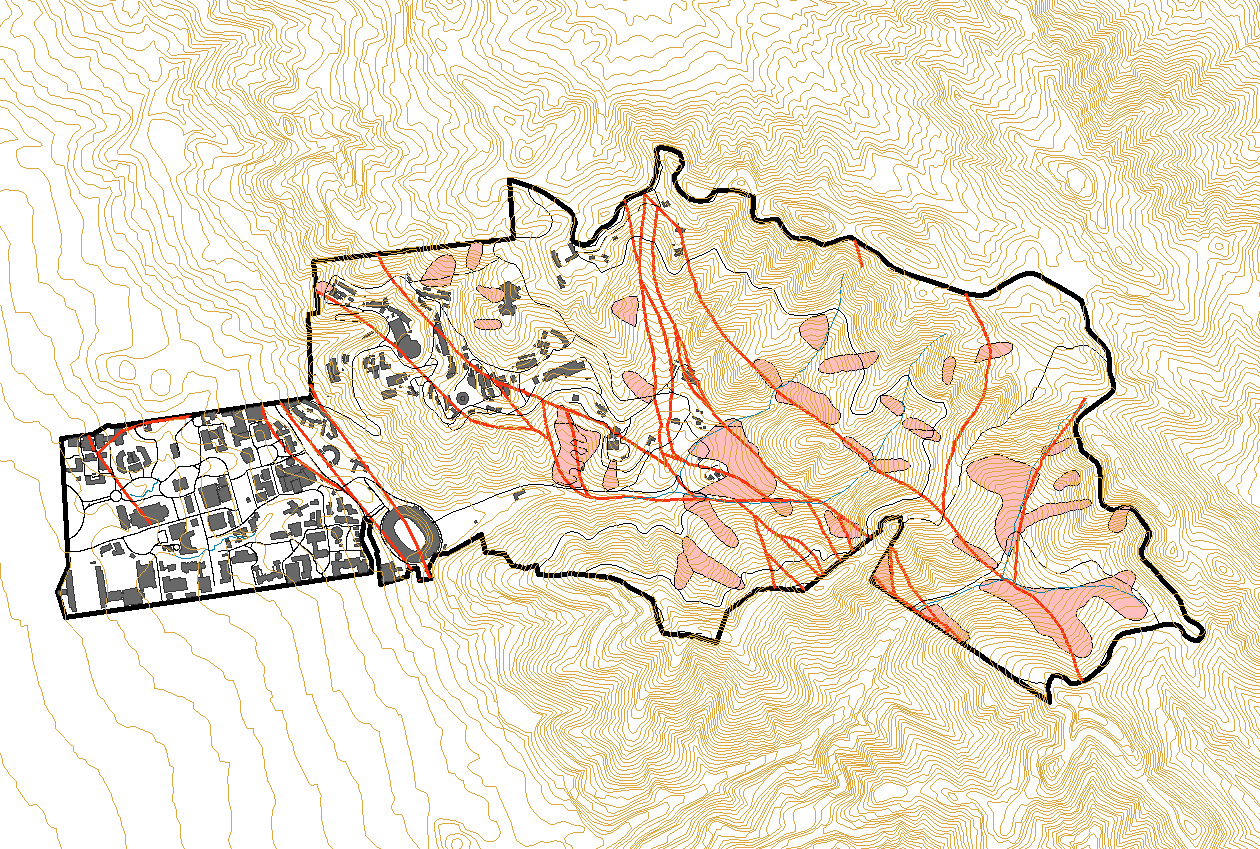
This map shows the landslides that have taken place on the campus,
along with buildings, roads, streams, and fault lines. Contour lines
are also present to give an idea of elevation. We can see from this
that landslides often take place in stream valleys. We can also see
that a number of buildings on the far eastern side of campus appear to
be very vulnerable to another landslide in the future.
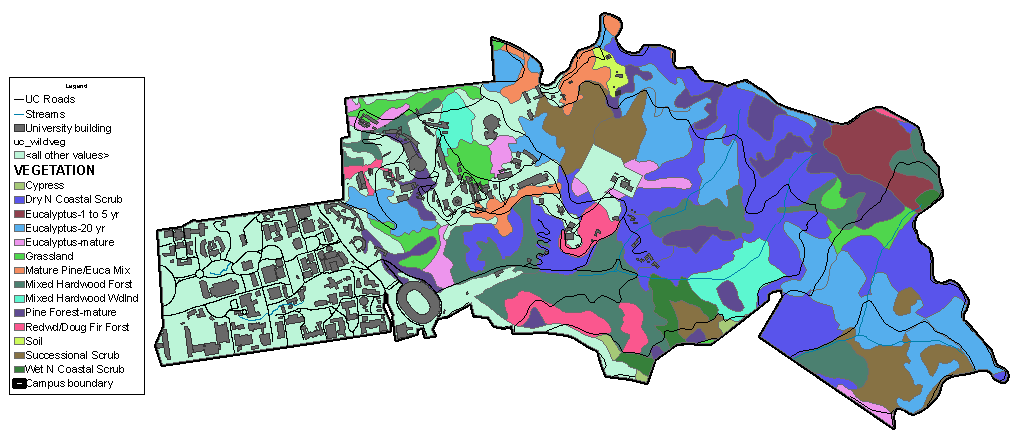
This map, as can be seen from the legend, shows the different
vegetation types prevalent on campus along with campus buildings,
roads, and streams. Unlike the other two maps, this map was exported
from layout view so that a legend could be added so that we could tell
which colors represent which vegetation types. One strangeness, in my
opinion, of the layout view is that the "zoom" button actually zooms
the map on the page, instead of the page itself. It is also more
complicated than it should be to get your current map view to simply be
fit to the entire page.
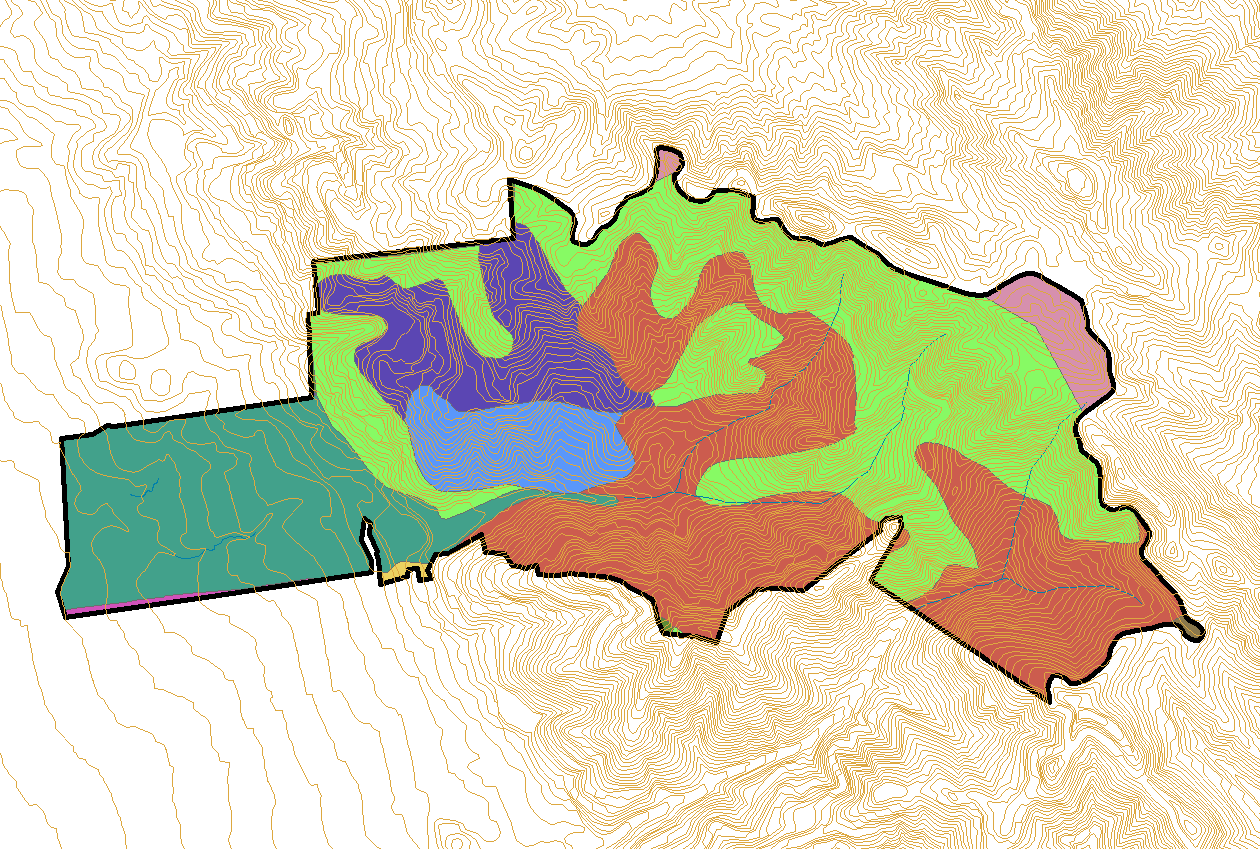
This map shows the different soil types on campus, along with contour
lines to show elevation. I decided not to display buildings so that the
map does not become too busy.
Components of ArcGIS
ArcMap is used to put together spatial data and render it on a map. It also allows you export these maps and lay them out on a page for printing. ArcCatalog allows you to browse your data and edit the metadata associated with it. It also allows you to see quick previews of the data so that you can get a quick idea of what the data represents. ArcToolbox provides a number of tools for manipulating and analyzing your data.
Supported data formats in ArcGIS
Data formats supported in ArcGIS (ArcView, ArcEditor, and ArcInfo)
- ArcInfo coverages
- ArcIMS feature services
- ArcIMS map services
- DGN (5.x to 8)
- DWG (Release 12 to AutoCAD 2006)
- DXF (Release 12 to AutoCAD 2006)
- Geodatabases
- Geography Network connections
- OLE DB tables
- PC ArcInfo coverages
- Rasters:
- ADRG Image (.IMG)
- ADRG Overview (.OVR)
- ADRG Legend (.LGG)
- ArcSDE raster
- BSB charts
- Compressed ARC Digitized Raster Graphics (CADRG)
- Controlled Image Base (CIB)
- Digital Geographic Information Exchange Standard (DIGEST)
- DTED Level 0, 1, and 2 (.DT*)
- ER Mapper (.ERS)
- ER Mapper Enhanced Compressed Wavelet (.ECW)
- ERDAS 7.5 GIS (.GIS)
- ERDAS 7.5 Lan (.LAN)
- ERDAS IMAGINE (.IMG)
- ERDAS Raw (.RAW)
- ESRI Band Interleaved by Line (.BIL)
- ESRI Band Interleaved by Pixel (.BIP)
- ESRI Band Sequential (.BSQ)
- ESRI GRID
- ESRI GRID Stack (<directory>)
- ESRI GRID Stack file (.STK)
- ESRI Raster Catalogs (Image Catalogs)
- Graphic Interchange Format (.GIF)
- Hierarchical Data Format (HDF) 4
- Idrisi Raster Format (RST)
- Intergraph raster file (.CIT or .COT)
- JPEG File Interchange Format, JIFF (.JPG) and JPEG 2000 (.JP2)
- LizardTech MrSID and MrSID Gen 3 (.SID)
- National Image Transfer Format, NITF 2.0 and 2.1 (.NTF)
- PC Raster (.MAP)
- PCI Geomatica (.PIX)
- Portable Network Graphics (.PNG)
- Raster Product Format (RPF)
- Tagged Image File Format, TIFF (.TIF)
- USGS DEM (.DEM)
- Windows bitmap (.BMP)
- XPixMap (.XPM)
- SDC
- SDE layers
- Shapefiles
- Text files (.TXT)
- TIN
- VPF
Additional data formats supported via importers in ArcInfo
Direct conversion of the following formats into a native ArcInfo format:
- ADS
- DFAD
- DIME
- DLG
- ETAK
- GIRAS
- IGDS
- IGES
- MOSS
- S-57
- SDTS (point, raster, and vector)
- SLF
- TIGER (through v2002)
- Sun Raster
Additional data formats supported via importers in ArcView and ArcEditor
Direct conversion of the following formats into native ArcView and ArcEditor formats:
- AGF
- MIF
- SDTS (Point and Raster)
back to Paul Borokhov – Section 101 – 07 Students – C188 home