Lab 11
Jump to Lab problems –
Creating my own data –
Mapping the results
Lab problems
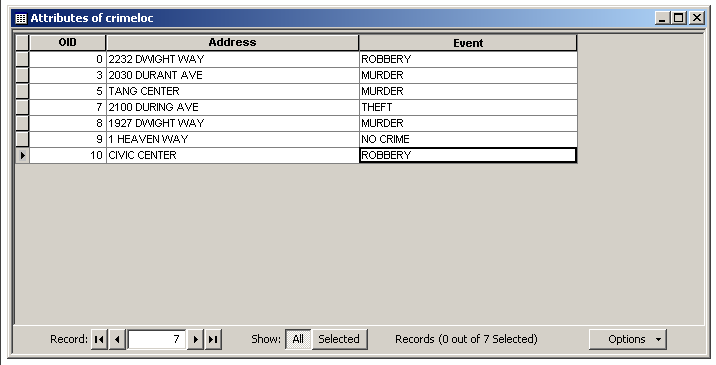
While doing the lab itself, I ran into a lot of problems with ArcMap and editing tabular data. For example, after entering all of the events data for the first table and saving my edits, a bunch of records disappeared:
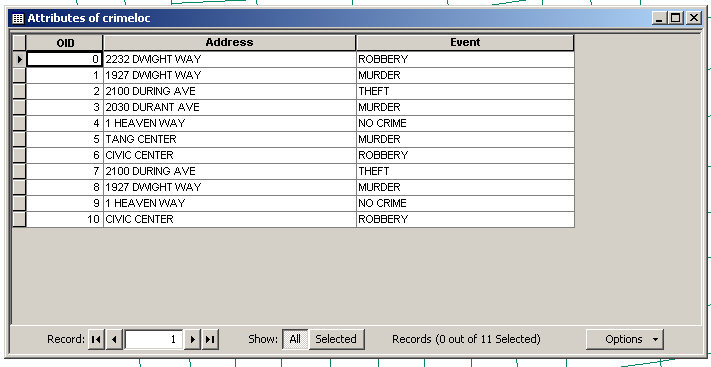
I went ahead and readded the missing records. Then, when I reopened ArcMap (due to other problems), the missing records came back and so now I had duplicate data:
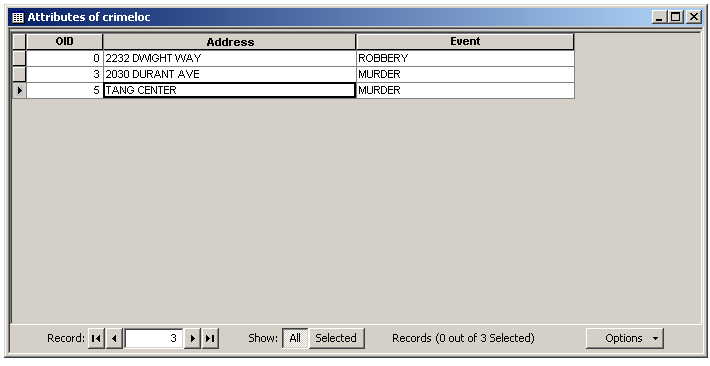
Consequently, I had to enter edit mode again and remove the duplicate records...finally getting the desired result:
Creating my own data
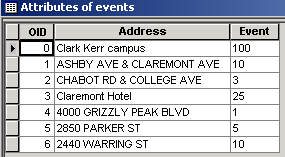
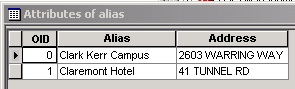
As my data, I decided to pick a number of somewhat random locations and chose the event to be the number of pizza deliveries to that location and the surrounding 5 houses in the last 30 days. My addresses were 4000 GRIZZLY PEAK BLVD, 2850 PARKER ST, and 2440 WARRING ST, with increasing number of deliveries in that order. My two intersections were ASHBY AVE & CLAREMONT AVE and CHABOT RD & COLLEGE AVE, and my two alias locations were Clark Kerr campus (with 100 deliveries) and Claremont Hotel (with 25).
Due to the amount of problems I ran into while doing the lab, I decided to enter my data in comma-delimited format instead and then import it. This, too, was not without adventures. For example, I changed one of my files but readding it to the layer in ArcMap would not fully reload the data, so I got something strange like this: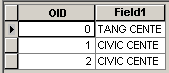
Restarting ArcMap resolved the issue, however, and I was finally able to import all my data. Then, I had to export the data to the DBF format, which was apparently required for it to be usable in the geocoding process. My two data tables looked like this:
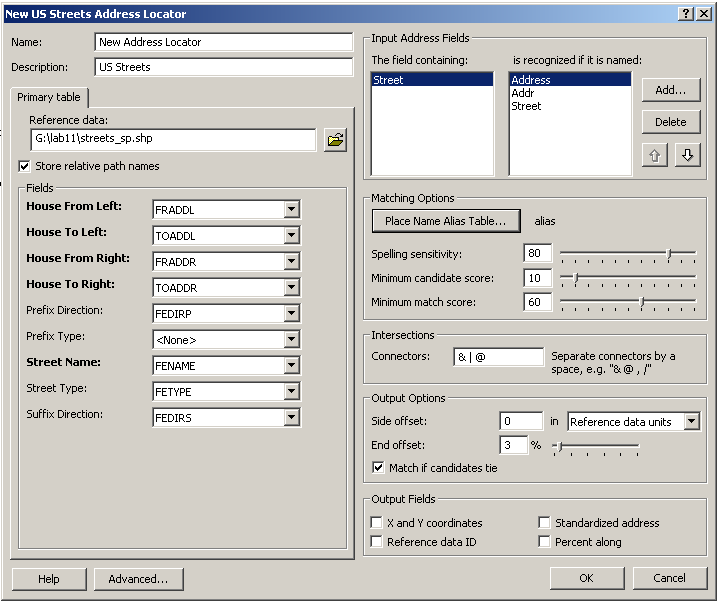
I then went ahead and created a new locator with my input data, with settings like this:
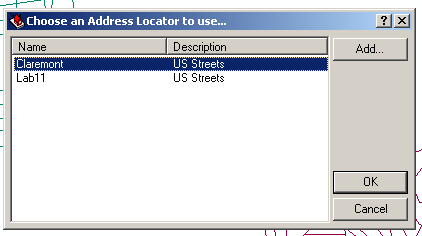
Then, I noticed that when you perform a geocode operation in ArcMap, you can add a locator to the list of those being used, but you can't remove existing locators from the list or reorder them, as seen in this image:
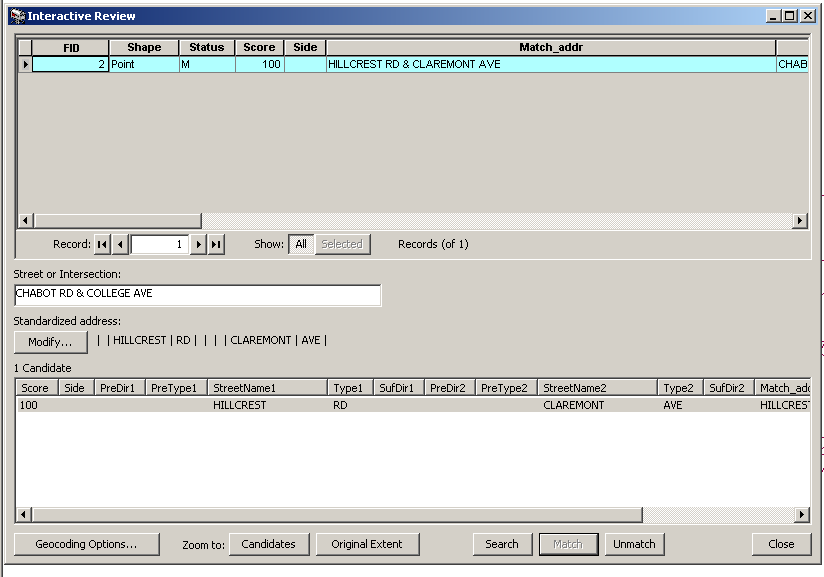
My geocode results held a surprise for me because one address was unmatched.
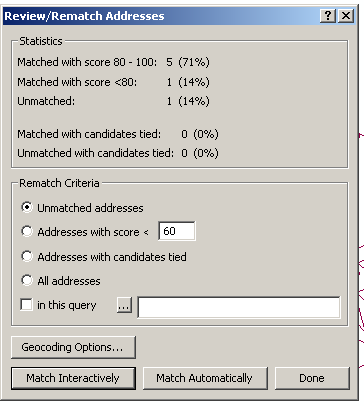
As it turned out, I had actually input an address that was not covered by the shapefile, so I simply performed an interactive match and entered a different address, as follows:
Mapping the results
After I had my geocoded results, it came time to represent them. In my data, the "event" was the number of pizza deliveries to the location in the past 30 days...as a result, Clark Kerr campus had a lot of deliveries, distant areas had very few, and the fraternity area had a medium amount. However, as I found out after importing my data from CSV, you can not change the field types of the data table fields...and you can't specify the type of each field during export, so all fields are assumed to be "string".
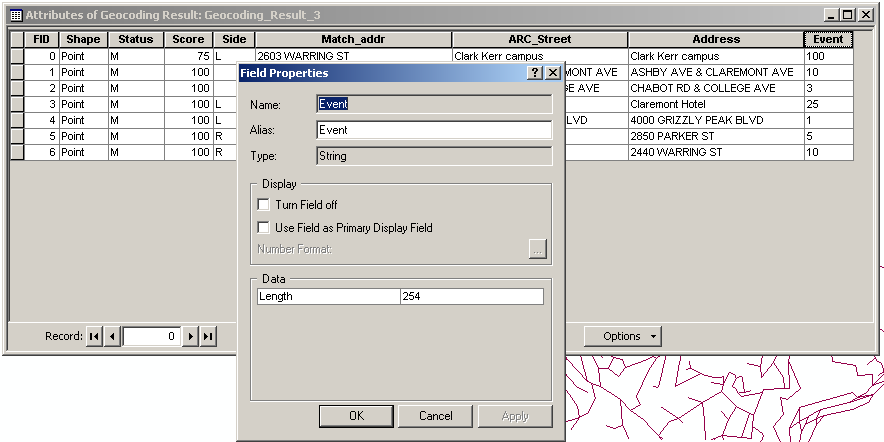
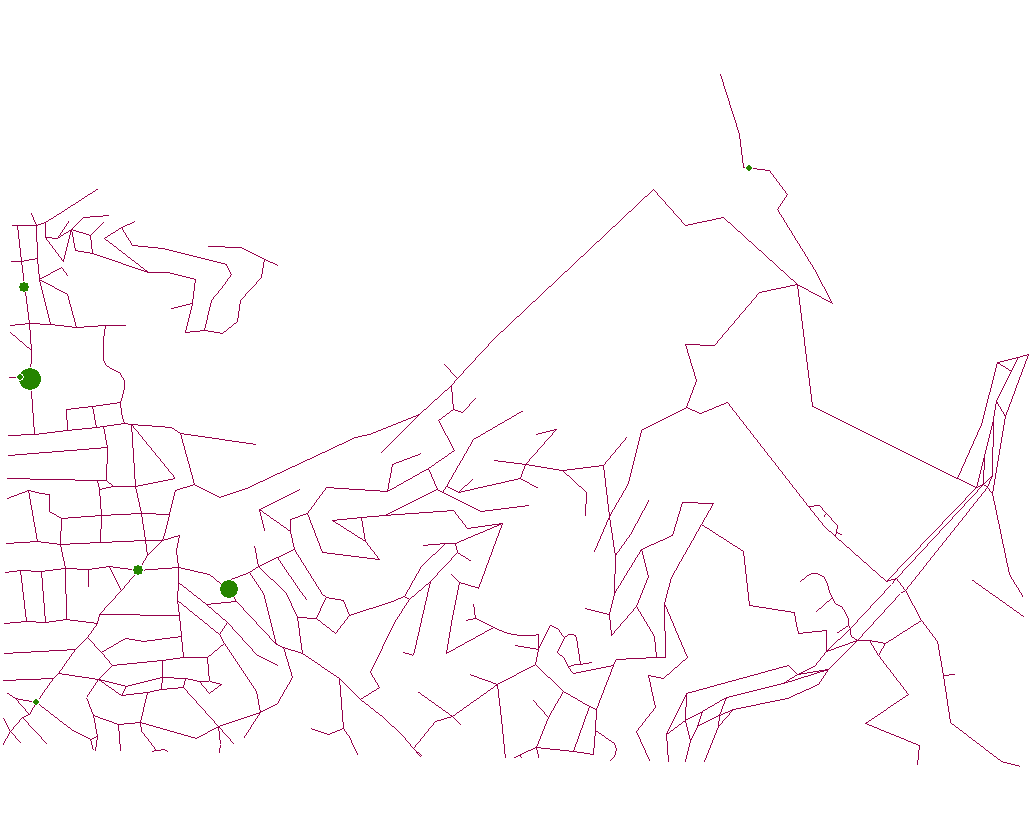
As a result, I created a new field whose type was short integer and just reentered the data into the data table. Then, I was able to use the Quantities->Graduated symbols to represent the address points on the map with 4 classes based on the number of deliveries to the location (this was why I needed the events field to not be text). My resulting map looked like this:
back to Paul
Borokhov – Section
101 – 07
Students – C188 home